
CB-SEM compared with PLS-SEM
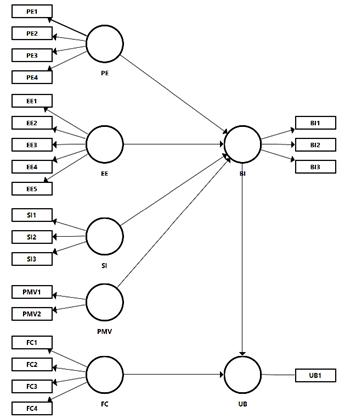
UTAUT Model
Reference:
Baishya, K., & Samalia, H. V. (2020). Extending Unified Theory of Acceptance and Use of Technology with Perceived Monetary Value for Smartphone Adoption at the Bottom of the Pyramid. International Journal of Information Management, 51, 102036.
Sample Size:
n= 590
Legend:
Performance expectancy (PE), Effort expectancy (EE), Subjective influence (SI), Perceived monetary value (PMV), Facilitating conditions (FC), Behavioral intention (BI), Use behavior (UB)
Standardized coefficients:
|
Measurement model relations |
CBSEM results using the lavaan package |
PLS results using SmartPLS |
|||||||
|
PE =~ |
ML |
GLS |
ULS |
WLS |
DWLS |
PLS |
PLSc |
Sumscores |
|
|
PE1 |
0.888 |
0.897 |
0.889 |
0.920 |
0.888 |
0.908 |
0.844 |
0.911 |
|
|
PE2 |
0.853 |
0.865 |
0.875 |
0.900 |
0.876 |
0.896 |
0.885 |
0.892 |
|
|
PE3 |
0.840 |
0.867 |
0.812 |
0.908 |
0.815 |
0.875 |
0.752 |
0.886 |
|
|
PE4 |
0.851 |
0.863 |
0.838 |
0.921 |
0.836 |
0.902 |
0.941 |
0.894 |
|
|
EE =~ |
|||||||||
|
EE1 |
0.847 |
0.889 |
0.879 |
0.893 |
0.878 |
0.875 |
0.852 |
0.874 |
|
|
EE2 |
0.858 |
0.885 |
0.850 |
0.888 |
0.846 |
0.883 |
0.805 |
0.885 |
|
|
EE3 |
0.830 |
0.834 |
0.808 |
0.838 |
0.810 |
0.871 |
0.835 |
0.872 |
|
|
EE4 |
0.833 |
0.826 |
0.826 |
0.878 |
0.825 |
0.872 |
0.857 |
0.870 |
|
|
EE5 |
0.829 |
0.830 |
0.818 |
0.845 |
0.818 |
0.868 |
0.847 |
0.868 |
|
|
SI =~ |
|||||||||
|
SI1 |
0.885 |
0.937 |
0.907 |
0.911 |
0.903 |
0.928 |
0.970 |
0.918 |
|
|
SI2 |
0.863 |
0.897 |
0.890 |
0.943 |
0.887 |
0.904 |
0.797 |
0.911 |
|
|
SI3 |
0.855 |
0.858 |
0.794 |
0.911 |
0.793 |
0.910 |
0.835 |
0.914 |
|
|
FC =~ |
|||||||||
|
FC1 |
0.822 |
0.812 |
0.841 |
0.864 |
0.836 |
0.882 |
0.832 |
0.857 |
|
|
FC2 |
0.902 |
0.900 |
0.891 |
0.928 |
0.890 |
0.916 |
0.867 |
0.891 |
|
|
FC3 |
0.383 |
0.416 |
0.441 |
0.393 |
0.439 |
0.514 |
0.470 |
0.612 |
|
|
FC4 |
0.900 |
0.909 |
0.858 |
0.903 |
0.858 |
0.916 |
0.859 |
0.891 |
|
|
PMV =~ |
|||||||||
|
PMV1 |
0.910 |
0.896 |
0.905 |
0.882 |
0.910 |
0.945 |
0.877 |
0.947 |
|
|
PMV2 |
0.873 |
0.889 |
0.860 |
0.985 |
0.858 |
0.949 |
0.906 |
0.947 |
|
|
BI =~ |
|||||||||
|
BI1 |
0.853 |
0.845 |
0.879 |
0.849 |
0.880 |
0.912 |
0.891 |
0.910 |
|
|
BI2 |
0.897 |
0.879 |
0.896 |
0.855 |
0.899 |
0.927 |
0.899 |
0.926 |
|
|
BI3 |
0.884 |
0.892 |
0.861 |
0.894 |
0.859 |
0.922 |
0.842 |
0.925 |
|
|
UB =~ |
|||||||||
|
UB1 |
1.000 |
1.000 |
1.000 |
1.000 |
1.000 |
1.000 |
1.000 |
1.000 |
|
|
Structural model relations |
CBSEM results using the lavaan package |
PLS results using SmartPLS |
|||||||
|
BI ~ |
ML |
GLS |
ULS |
WLS |
DWLS |
PLS |
PLSc |
Sumscores |
|
|
PE |
0.242 |
0.236 |
0.247 |
0.160 |
0.248 |
0.231 |
0.242 |
0.228 |
|
|
EE |
0.176 |
0.234 |
0.193 |
0.210 |
0.196 |
0.179 |
0.180 |
0.179 |
|
|
SI |
0.222 |
0.177 |
0.220 |
0.221 |
0.225 |
0.201 |
0.213 |
0.200 |
|
|
PMV |
0.226 |
0.276 |
0.242 |
0.164 |
0.235 |
0.214 |
0.233 |
0.214 |
|
|
UB ~ |
|||||||||
|
FC |
0.386 |
0.370 |
0.401 |
0.184 |
0.404 |
0.369 |
0.389 |
0.365 |
|
|
BI |
0.321 |
0.327 |
0.330 |
0.401 |
0.329 |
0.302 |
0.298 |
0.304 |
|
We analyzed the significance of all solutions except of those with negative variances. For CBSEM we used the p-value, for PLS the 95% percentile bootstrap confidence intervals. All results are significant on the 5% probability of error level.
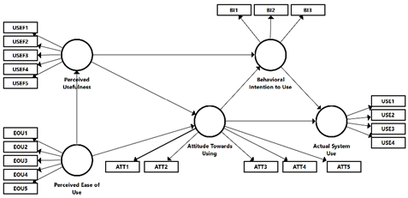
TAM Model
Reference:
Anderson, C., Al-Gahtani, S.S. and Hubona, G.S. (2011), "The Value of TAM Antecedents in Global IS Development and Research", Journal of Organizational and End User Computing, Vol. 23 No. 1, pp. 18-37.
Sample Size:
n= 1,190
Legend:
Attitude (ATT), Behavioral intention to use (BI), Perceived ease of use (PEOU), Perceived usefulness (PU), Actual system use (USE)
Standardized coefficients:
|
Measurement model relations |
CBSEM results using the lavaan package |
PLS results using SmartPLS |
|||||||
|
BI =~ |
ML |
GLS |
ULS |
WLS |
DWLS |
PLS |
PLSc |
Sumscores |
|
|
BI1 |
0.711 |
0.695 |
0.804 |
0.695 |
0.791 |
0.855 |
0.877 |
0.831 |
|
|
BI2 |
0.771 |
0.753 |
0.683 |
0.753 |
0.628 |
0.831 |
0.591 |
0.867 |
|
|
BI3 |
0.869 |
0.846 |
0.807 |
0.846 |
0.753 |
0.890 |
0.849 |
0.884 |
|
|
PEOU =~ |
|
||||||||
|
EOU1 |
0.69 |
0.625 |
0.695 |
0.625 |
0.694 |
0.765 |
0.696 |
0.777 |
|
|
EOU2 |
0.778 |
0.734 |
0.766 |
0.734 |
0.764 |
0.827 |
0.780 |
0.823 |
|
|
EOU3 |
0.837 |
0.802 |
0.842 |
0.802 |
0.842 |
0.863 |
0.830 |
0.853 |
|
|
EOU4 |
0.754 |
0.707 |
0.759 |
0.707 |
0.762 |
0.809 |
0.792 |
0.801 |
|
|
EOU5 |
0.723 |
0.635 |
0.724 |
0.635 |
0.717 |
0.789 |
0.681 |
0.801 |
|
|
PU =~ |
|
||||||||
|
USEF1 |
0.739 |
0.741 |
0.634 |
0.741 |
0.603 |
0.808 |
0.811 |
0.808 |
|
|
USEF2 |
0.806 |
0.793 |
0.649 |
0.793 |
0.616 |
0.847 |
0.796 |
0.849 |
|
|
USEF3 |
0.855 |
0.856 |
0.659 |
0.856 |
0.615 |
0.880 |
0.817 |
0.88 |
|
|
USEF4 |
0.839 |
0.835 |
0.665 |
0.835 |
0.627 |
0.866 |
0.821 |
0.865 |
|
|
USEF5 |
0.815 |
0.820 |
0.646 |
0.820 |
0.601 |
0.860 |
0.812 |
0.86 |
|
|
ATT =~ |
|||||||||
|
ATT1 |
0.877 |
0.878 |
0.876 |
0.878 |
0.886 |
0.900 |
0.912 |
0.895 |
|
|
ATT2 |
0.884 |
0.896 |
0.887 |
0.896 |
0.895 |
0.905 |
0.916 |
0.899 |
|
|
ATT3 |
0.870 |
0.861 |
0.867 |
0.861 |
0.874 |
0.897 |
0.892 |
0.893 |
|
|
ATT4 |
0.840 |
0.901 |
0.822 |
0.901 |
0.825 |
0.880 |
0.831 |
0.886 |
|
|
ATT5 |
0.840 |
0.900 |
0.791 |
0.900 |
0.780 |
0.878 |
0.751 |
0.888 |
|
|
USE =~ |
|||||||||
|
USE1 |
0.787 |
0.778 |
0.638 |
0.778 |
0.654 |
0.800 |
0.702 |
0.783 |
|
|
USE2 |
0.729 |
0.720 |
0.602 |
0.720 |
0.589 |
0.761 |
0.641 |
0.756 |
|
|
USE3 |
0.592 |
0.614 |
0.763 |
0.614 |
0.705 |
0.772 |
0.667 |
0.771 |
|
|
USE4 |
0.458 |
0.468 |
0.557 |
0.468 |
0.551 |
0.664 |
0.581 |
0.689 |
|
|
Structural model relations: |
CBSEM results using the lavaan package |
PLS results using SmartPLS |
|||||||
|
BI ~ |
ML |
GLS |
ULS |
WLS |
DWLS |
PLS |
PLSc |
Sumscores |
|
|
ATT |
0.160 |
0.189 |
-0.102 |
0.543 |
-0.149 |
0.172 |
0.174 |
0.170 |
|
|
PU |
0.466 |
0.558 |
0.867 |
0.281 |
0.949 |
0.401 |
0.461 |
0.390 |
|
|
PU ~ |
|||||||||
|
PEOU |
0.509 |
0.577 |
0.748 |
0.611 |
0.757 |
0.445 |
0.500 |
0.444 |
|
|
ATT ~ |
|||||||||
|
PEOU |
0.285 |
0.333 |
0.153 |
0.615 |
0.036(n.s.) |
0.253 |
0.272 |
0.250 |
|
|
PU |
0.264 |
0.196 |
0.400 |
0.212 |
0.522 |
0.267 |
0.276 |
0.268 |
|
|
USE ~ |
|||||||||
|
ATT |
0.288 |
0.347 |
0.354 |
0.761 |
0.311 |
0.271 |
0.316 |
0.276 |
|
|
BI |
0.189 |
0.081(n.s.) |
0.219 |
-0.322 |
0.265 |
0.134 |
0.164 |
0.124 |
|
(n.s.) = nonsignificant
We analyzed the significance of all solutions except of those with negative variance. For CBSEM we used the p-value, for PLS the 95% percentile bootstrap confidence intervals. All results are significant on the 5% probability of error level. The only exceptions are the BI to USE relationship in the GLS results and the PEOU to ATT relationship in the DWLS results of CBSEM.